APM开源方案Matrix —— ResourceCanary

本文主要介绍Matrix的Resource部分,涉及Activity泄漏、Bitmap对象冗余的检测逻辑。

再回顾下Matrix概览中提到的ResourceCanary模块的特点:基于 WeakReference 的特性和 Square Haha 库开发的 Activity 泄漏和 Bitmap 重复创建检测工具。

主要特性如下:

  • 分离了检测和分析部分,便于在不打断自动化测试的前提下持续输出分析后的检测结果
  • 对检测部分生成的 Hprof 文件进行了裁剪,移除了大部分无用数据,降低了传输 Hprof 文件的开销
  • 增加了重复 Bitmap 对象检测,方便通过减少冗余 Bitmap 数量,降低内存消耗

如何判断Activity发生泄漏

判断Activity是否泄漏需要确定两个问题:

  • 如何在一个恰当的时机得知一个Activity已经结束了生命周期
  • 如何判断一个Activity无法被GC机制回收

这部分内容,Matrix借鉴了LeakCanary的做法,对LeakCanary比较熟悉的同学可以跳过。后续将针对这两个问题进行实现分析。

Demo中,TestLeakActivity被一个静态变量testLeaks持有:

1
2
3
4
5
6
7
8
9
public class TestLeakActivity extends Activity {
private static Set<Activity> testLeaks = new HashSet<>();
@Override
protected void onCreate(@Nullable Bundle savedInstanceState) {
super.onCreate(savedInstanceState);

testLeaks.add(this);
}
}

测试结果是,退出页面时TestLeakActivity无法正常销毁,页面发生泄漏。

通过操作demo,可以看到如下IDE的输出log:

1
2
3
V/Matrix.ActivityRefWatcher: triggering gc...
V/Matrix.ActivityRefWatcher: gc was triggered.
I/Matrix.ActivityRefWatcher: activity with key [MATRIX_RESCANARY_REFKEY_sample.tencent.matrix.resource.TestLeakActivity_2bd863cd6b8d4b78ae371fcc660c3b66] should be recycled but actually still exists in N times, wait for next detection to confirm.

上面log意思是TestLeakActivity应该被回收但是仍然存在,即发生了泄漏。

获取已销毁Activity的信息

针对第一个问题“如何在一个恰当的时机得知一个Activity已经结束了生命周期”,我们看看Matrix怎么做的。

Matrix wiki中也提到的了解决方法:

  • 让所有Activity继承一个BaseActivity,然后在BaseActivity.onDestroy()方法中进行记录。
  • 通过某种机制得知Activity.onDestroy()方法被调用,然后进行记录
    • 4.0以前可以通过反射替换ActivityThread.mInstrumentation对象为自己的代理,然后在代理中的callActivityOnDestroy()方法中记录。
    • 4.0以后可以通过Application.registerActivityLifecycleCallbacks()方法注册一个回调对象,在回调对象的onActivityDestroyed()方法中记录。

显然第一种方法对业务侧入侵过重,不合适。第二种方法,考虑到4.0以前机器分布已经比较少了,Matrix直接使用Application.registerActivityLifecycleCallbacks()方式。

ResouceCanary中处理Activity泄漏问题的接口类是ResourcePlugin,看下代码:

1
2
3
4
5
6
7
8
9
10
11
12
13
14
15
16
17
18
19
20
21
22
23
24
25
26
27
28
29
30
31
32
33
34
com.tencent.matrix.resource.ResourcePlugin

public class ResourcePlugin extends Plugin {
private final ResourceConfig mConfig;
private ActivityRefWatcher mWatcher = null;

//加载配置
public ResourcePlugin(ResourceConfig config) {
mConfig = config;
}

//处理系统层面的泄漏问题
public static void activityLeakFixer(Application application) {...}

public ActivityRefWatcher getWatcher() {
return mWatcher;
}

@Override
public void init(Application app, PluginListener listener) {
super.init(app, listener);
...
// ActivityRefWatcher的初始化
mWatcher = new ActivityRefWatcher(app, this);
}

@Override
public void start() {
super.start();
...
//启动ActivityRefWatcher,监听Activity生命周期
mWatcher.start();
}
}

上面代码在组件启动时,初始化了ActivityRefWatcher,看下mWatcher.start()

1
2
3
4
5
6
7
8
9
10
11
12
13
14
com.tencent.matrix.resource.watcher.ActivityRefWatcher

@Override
public void start() {
stopDetect();
final Application app = mResourcePlugin.getApplication();
if (app != null) {
// 注册Application.ActivityLifecycleCallbacks监听
app.registerActivityLifecycleCallbacks(mRemovedActivityMonitor);

// Activity泄漏检测任务调度,并根据DumpMode(可配置)选项对外输出泄漏提示
scheduleDetectProcedure();
}
}

上面代码主要做了注册Activity生命周期监听器和Activity泄漏检测任务调度这两件事。其中Activity泄漏检测任务调度的逻辑在后面《如何判断Activity无法被GC回收》会讲到。看下mRemovedActivityMonitor的逻辑:

1
2
3
4
5
6
7
8
9
com.tencent.matrix.resource.watcher.ActivityRefWatcher

private final Application.ActivityLifecycleCallbacks mRemovedActivityMonitor = new ActivityLifeCycleCallbacksAdapter() {

@Override
public void onActivityDestroyed(Activity activity) {
pushDestroyedActivityInfo(activity);
}
};

当一个Activity销毁时,即Activity.onDestroy()执行时,Application.ActivityLifecycleCallbacks.onActivityDestroyed()就会被调用,看下pushDestroyedActivityInfo()

1
2
3
4
5
6
7
8
9
10
11
12
13
14
15
16
17
18
19
20
com.tencent.matrix.resource.watcher.ActivityRefWatcher

private void pushDestroyedActivityInfo(Activity activity) {
final String activityName = activity.getClass().getName();
//泄漏Activity的上报去重
if (!mResourcePlugin.getConfig().getDetectDebugger() && isPublished(activityName)) {
MatrixLog.i(TAG, "activity leak with name %s had published, just ignore", activityName);
return;
}
//主要根据UUID和Activity信息组装key
final UUID uuid = UUID.randomUUID();
final StringBuilder keyBuilder = new StringBuilder();
keyBuilder.append(ACTIVITY_REFKEY_PREFIX).append(activityName)
.append('_').append(Long.toHexString(uuid.getMostSignificantBits())).append(Long.toHexString(uuid.getLeastSignificantBits()));
final String key = keyBuilder.toString();

final DestroyedActivityInfo destroyedActivityInfo
= new DestroyedActivityInfo(key, activity, activityName);
mDestroyedActivityInfos.add(destroyedActivityInfo);
}

上面代码主要做了两件事:

  • 通过isPublished()优化上报逻辑:泄漏的Activity,记录其类名,放到FilePublisher.mPublishedMap,后续再检测到该Activity且在过期时间内,则走去重逻辑,避免重复提示该Activity已泄漏
  • 根据UUID和Activity信息组装key,将泄漏的Activity信息存放到mDestroyedActivityInfos,其中DestroyedActivityInfo内部使用一个WeakReference对象持有该Activity

总结:

针对“如何在一个恰当的时机得知一个Activity已经结束了生命周期”,Matrix和LeakCanary的逻辑一样,通过Application.registerActivityLifecycleCallbacks()方法注册一个回调对象,在回调对象的onActivityDestroyed()方法中记录泄漏页面信息。

如何判断Activity无法被GC回收

Activity被销毁后,如何判断其是否发生了泄漏呢?针对前面提到的第二个问题“如何判断一个Activity无法被GC机制回收”,Matrix的做法大致是这样的:

首先根据前面《获取已销毁Activity的信息》部分获取destroy的Activity,该Activity由WeakReference持有,然后主动触发一次“有效的GC”,如果该Activity能够被回收,则持有它的WeakReference会被置空;反之,如果持有它的WeakReference不为空,即GC无法回收这个已经销毁的Activity,判定该Activity发生了泄漏。

上面说的“有效的GC”,是因为JVM没有提供强制触发GC的API,像System.gc()或者Runtime.getRuntime().gc()都是建议系统进行GC,系统并不一定真正的触发GC。

针对这个问题,Matrix使用了“哨兵机制”,即增加了一个“哨兵对象”,该对象由WeakReference持有,执行Runtime.getRuntime().gc()后,如果该哨兵WeakReference被置空,则说明刚才的gc()调用,系统确实触发了一次GC操作。

看下这部分逻辑的代码,实现细节在ActivityRefWatcher.scheduleDetectProcedure()

1
2
3
4
5
com.tencent.matrix.resource.watcher.ActivityRefWatcher

private void scheduleDetectProcedure() {
mDetectExecutor.executeInBackground(mScanDestroyedActivitiesTask);
}

看下mDetectExecutor.executeInBackground()

1
2
3
4
5
6
7
8
9
10
11
12
13
14
15
16
17
18
com.tencent.matrix.resource.watcher.RetryableTaskExecutor

public void executeInBackground(final RetryableTask task) {
postToBackgroundWithDelay(task, 0);
}

private void postToBackgroundWithDelay(final RetryableTask task, final int failedAttempts) {
mBackgroundHandler.postDelayed(new Runnable() {
@Override
public void run() {
RetryableTask.Status status = task.execute();
//如果task.execute()返回RETRY,则进行延时重试
if (status == RetryableTask.Status.RETRY) {
postToBackgroundWithDelay(task, failedAttempts + 1);
}
}
}, mDelayMillis);
}

上面代码就是在异步线程执行mScanDestroyedActivitiesTask,当该task返回值为RetryableTask.Status.RETRY时,则该task进行延时重试。看下该task内容:

1
2
3
4
5
6
7
8
9
10
11
12
13
14
15
16
17
18
19
20
21
22
23
24
25
26
27
28
29
30
31
32
33
34
35
36
37
38
39
40
41
42
43
44
45
46
47
48
49
50
51
52
53
54
55
56
57
58
59
60
61
62
63
64
65
66
67
68
69
70
71
72
73
74
75
76
77
78
79
80
81
82
83
84
85
86
87
88
89
90
91
92
93
94
95
96
97
98
99
100
101
102
103
104
105
106
107
108
109
110
111
112
113
114
115
116
117
118
119
120
121
122
123
124
125
126
127
128
129
130
131
132
com.tencent.matrix.resource.watcher.ActivityRefWatcher

private final RetryableTask mScanDestroyedActivitiesTask = new RetryableTask() {

@Override
public Status execute() {
//step1.没有destroy的Activity,则重试
// If destroyed activity list is empty, just wait to save power.
if (mDestroyedActivityInfos.isEmpty()) {
MatrixLog.i(TAG, "DestroyedActivityInfo isEmpty!");
return Status.RETRY;
}
...

//step2.构建“哨兵”
final WeakReference<Object> sentinelRef = new WeakReference<>(new Object());

//step3.触发gc
triggerGc();

//“哨兵”没有被释放,说明step3并没有真正触发内存回收
if (sentinelRef.get() != null) {
// System ignored our gc request, we will retry later.
MatrixLog.d(TAG, "system ignore our gc request, wait for next detection.");
return Status.RETRY;
}

final Iterator<DestroyedActivityInfo> infoIt = mDestroyedActivityInfos.iterator();

while (infoIt.hasNext()) {
final DestroyedActivityInfo destroyedActivityInfo = infoIt.next();

//step4. 去重逻辑,避免重复提示Activity泄漏
if (!mResourcePlugin.getConfig().getDetectDebugger() && isPublished(destroyedActivityInfo.mActivityName) && mDumpHprofMode != ResourceConfig.DumpMode.SILENCE_DUMP) {
MatrixLog.v(TAG, "activity with key [%s] was already published.", destroyedActivityInfo.mActivityName);
infoIt.remove();
continue;
}
//step5.再次检测destroy的Activity是否被释放
if (destroyedActivityInfo.mActivityRef.get() == null) {
// The activity was recycled by a gc triggered outside.
MatrixLog.v(TAG, "activity with key [%s] was already recycled.", destroyedActivityInfo.mKey);
infoIt.remove();
continue;
}

//step6.检测次数加1
++destroyedActivityInfo.mDetectedCount;

//step7.检测次数小于最大重复检测次数,等下一次重试再安全check是否确实泄漏
if (destroyedActivityInfo.mDetectedCount < mMaxRedetectTimes
|| !mResourcePlugin.getConfig().getDetectDebugger()) {
// Although the sentinel tell us the activity should have been recycled,
// system may still ignore it, so try again until we reach max retry times.
MatrixLog.i(TAG, "activity with key [%s] should be recycled but actually still \n"
+ "exists in %s times, wait for next detection to confirm.",
destroyedActivityInfo.mKey, destroyedActivityInfo.mDetectedCount);
continue;
}

MatrixLog.i(TAG, "activity with key [%s] was suspected to be a leaked instance. mode[%s]", destroyedActivityInfo.mKey, mDumpHprofMode);

//step8.根据DumpMode执行不同的泄漏提示策略
//step8.1 SILENCE_DUMP模式下,以IssueActivity形式展示泄漏Activity信息
if (mDumpHprofMode == ResourceConfig.DumpMode.SILENCE_DUMP) {
if (mResourcePlugin != null && !isPublished(destroyedActivityInfo.mActivityName)) {
final JSONObject resultJson = new JSONObject();
try {
resultJson.put(SharePluginInfo.ISSUE_ACTIVITY_NAME, destroyedActivityInfo.mActivityName);
} catch (JSONException e) {
MatrixLog.printErrStackTrace(TAG, e, "unexpected exception.");
}
mResourcePlugin.onDetectIssue(new Issue(resultJson));
}
if (null != activityLeakCallback) {
activityLeakCallback.onLeak(destroyedActivityInfo.mActivityName, destroyedActivityInfo.mKey);
}
}
//step8.2 AUTO_DUMP模式下,Toast提示并保存裁剪后hprof信息文件
else if (mDumpHprofMode == ResourceConfig.DumpMode.AUTO_DUMP) {
final File hprofFile = mHeapDumper.dumpHeap();
if (hprofFile != null) {
markPublished(destroyedActivityInfo.mActivityName);
final HeapDump heapDump = new HeapDump(hprofFile, destroyedActivityInfo.mKey, destroyedActivityInfo.mActivityName);
mHeapDumpHandler.process(heapDump);
infoIt.remove();
} else {
MatrixLog.i(TAG, "heap dump for further analyzing activity with key [%s] was failed, just ignore.",
destroyedActivityInfo.mKey);
infoIt.remove();
}
}
//step8.3 MANUAL_DUMP模式下,以通知形式提示泄漏信息
else if (mDumpHprofMode == ResourceConfig.DumpMode.MANUAL_DUMP) {
NotificationManager notificationManager = (NotificationManager) context.getSystemService(Context.NOTIFICATION_SERVICE);
String dumpingHeapContent = context.getString(R.string.resource_canary_leak_tip);
String dumpingHeapTitle = destroyedActivityInfo.mActivityName;
mContentIntent.putExtra(SharePluginInfo.ISSUE_ACTIVITY_NAME, destroyedActivityInfo.mActivityName);
mContentIntent.putExtra(SharePluginInfo.ISSUE_REF_KEY, destroyedActivityInfo.mKey);
PendingIntent pIntent = PendingIntent.getActivity(context, 0, mContentIntent,
PendingIntent.FLAG_UPDATE_CURRENT);
NotificationCompat.Builder builder = new NotificationCompat.Builder(context)
.setContentTitle(dumpingHeapTitle)
.setContentIntent(pIntent)
.setContentText(dumpingHeapContent);
Notification notification = buildNotification(context, builder);
notificationManager.notify(NOTIFICATION_ID, notification);

infoIt.remove();
markPublished(destroyedActivityInfo.mActivityName);
MatrixLog.i(TAG, "show notification for notify activity leak. %s", destroyedActivityInfo.mActivityName);
}
//step8.4 NO_DUMP模式下,以IssueActivity形式展示泄漏Activity信息
else {
// Lightweight mode, just report leaked activity name.
MatrixLog.i(TAG, "lightweight mode, just report leaked activity name.");
markPublished(destroyedActivityInfo.mActivityName);
if (mResourcePlugin != null) {
final JSONObject resultJson = new JSONObject();
try {
resultJson.put(SharePluginInfo.ISSUE_ACTIVITY_NAME, destroyedActivityInfo.mActivityName);
} catch (JSONException e) {
MatrixLog.printErrStackTrace(TAG, e, "unexpected exception.");
}
mResourcePlugin.onDetectIssue(new Issue(resultJson));
}
}
}

return Status.RETRY;
}
};

上面这部分代码主要做了8件事,注释中都一一标明,本质上是利用“哨兵”机制和去重策略,准确的找到无法被GC回收的已销毁Activity,然后再根据外部配置的DumpMode输出泄漏Activity的信息。

测试内存泄漏时,需要在MatrixApplication中ResourceCanary配置初始化过程中,将ResourceConfig.Builder.setDetectDebuger()传true才能看到具体的泄漏信息。比如我们把DumpMode改成MANUAL_DUMP,测试TestLeakActivity时,可以在通知栏看到如下信息,即TestLeakActivity发生了泄漏。

Hprof

在分析泄漏对象信息及引用链时,需要对Hprof有一些背景知识,下面介绍下Hprof相关内容。

Hprof文件也叫堆转储文件,包含了dump时刻内存中的所有对象的信息,包括类的描述、实例的数据和引用关系、线程的栈信息等。

如何获取Hprof文件

代码中可以使用Debug.dumpHprofData(file)方法获取Hprof文件。

平时开发定位问题,可以直接用AndroidStudio中的Profiler获取hprof文件。官方文档使用 Memory Profiler 查看 Java 堆和内存分配比较详细的介绍了hprof的使用方法,具体可看官网。如果AS底部控制台没有Profiler选项,也可以通过AndroidStudio顶部Run菜单里面的profiler选项启动profiler。

Profiler目前已经是非常强大且简单易用的性能分析工具,可以分析CPU使用率、内存占用、网络使用、方法耗时等各种指标。笔者平时跟踪代码,获取方法调用栈、分析方法耗时等,也经常使用该工具,比如之前分析Matrix-Trace源码分析文章时,通过Profiler的方法调用栈就比较容易的看到哪些方法是通过插桩实现的,也方便快速熟悉陌生的项目,建议大家多学习使用该工具。

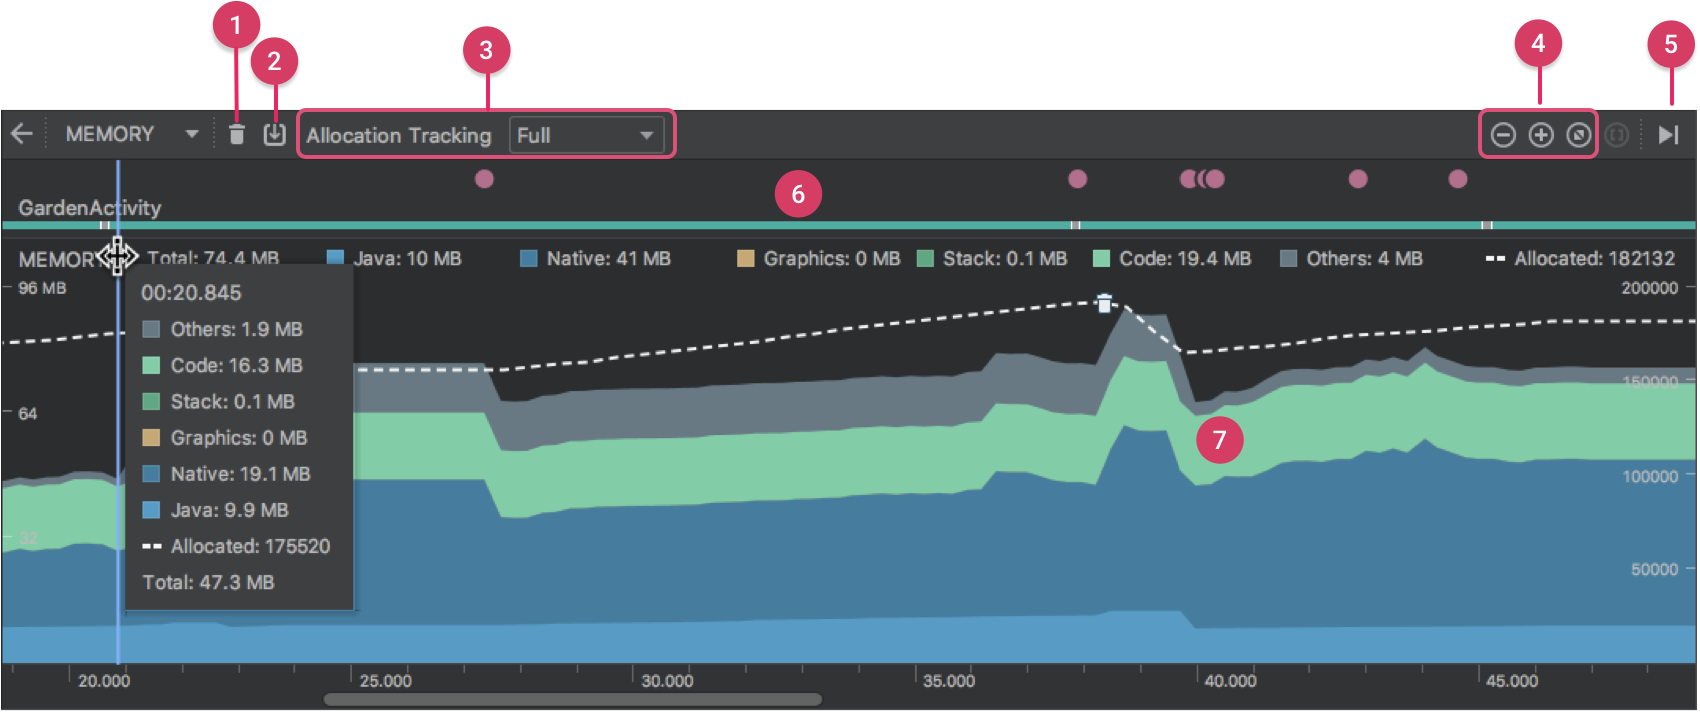
借用官网中提供的图片,下图中的“2”可dump出hprof文件。开发过程中,rocord一段App操作后,可以把操作后的堆栈信息用这种方式dump出来,后续便可使用AS导入hprof文件,方便分析。

将本地Hprof文件导入Profiler中:
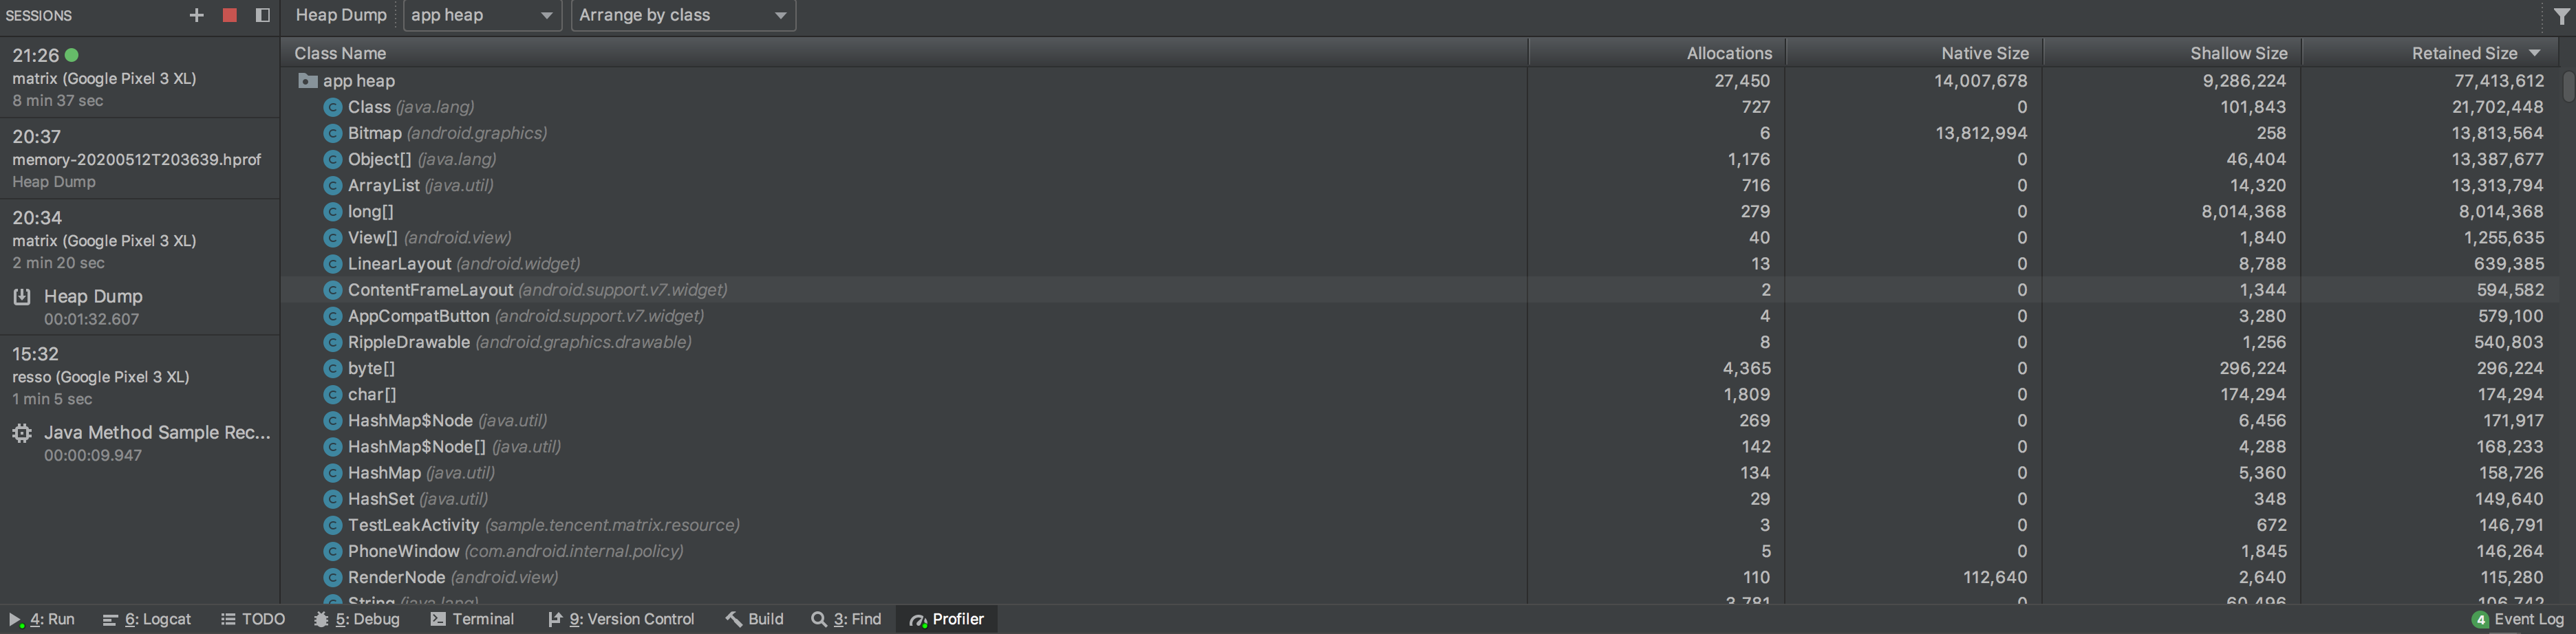
上图中各个列的含义:

  • Allocations:堆中的分配数。
  • Native Size:此对象类型使用的原生内存总量(以字节为单位)。只有在使用 Android 7.0 及更高版本时,才会看到此列。您会在此处看到采用 Java 分配的某些对象的内存,因为 Android 对某些框架类(如 Bitmap)使用原生内存。
  • Shallow Size:此对象类型使用的 Java 内存总量(以字节为单位)。
  • Retained Size:为此类的所有实例而保留的内存总大小(以字节为单位)。
如何获取引用链

前面提到如何获取泄漏Activity的信息,定位问题时,还需要计算泄漏Activity对象到GCRoots的强引用链。GCRoots对象特点是,他们虽然不被其他生命周期更长的对象持有,但JVM特性导致这类对象不会被GC回收。因此,从这类对象出发,经过一系列强引用的对象也都无法被回收。这部分内容可以看看这篇文章

GCRoots包括下面5类对象:

  • 静态成员,因为Java中的类,即被JVM system class loader加载的类无法卸载,也就无法被回收,典型的就是类的静态成员以及被静态成员持有的对象都是无法被GC的
  • 局部变量或方法参数持有的对象
  • JNI Reference,包括JNILocalReference、JNIGlobalReference持有的对象
  • 活动的Thread实例
  • synchronized关键字用到的对象

如果某个Activity被泄漏,则必然存在从它到某个GC Root的强引用链。只要将这条强引用链找出来,开发者就能根据引用链上的对象找到合适的修改点快速解决问题。

Hprof文件格式可以参考这份文档Binary Dump Format一节,文档中GCRoots的Tag格式如下:

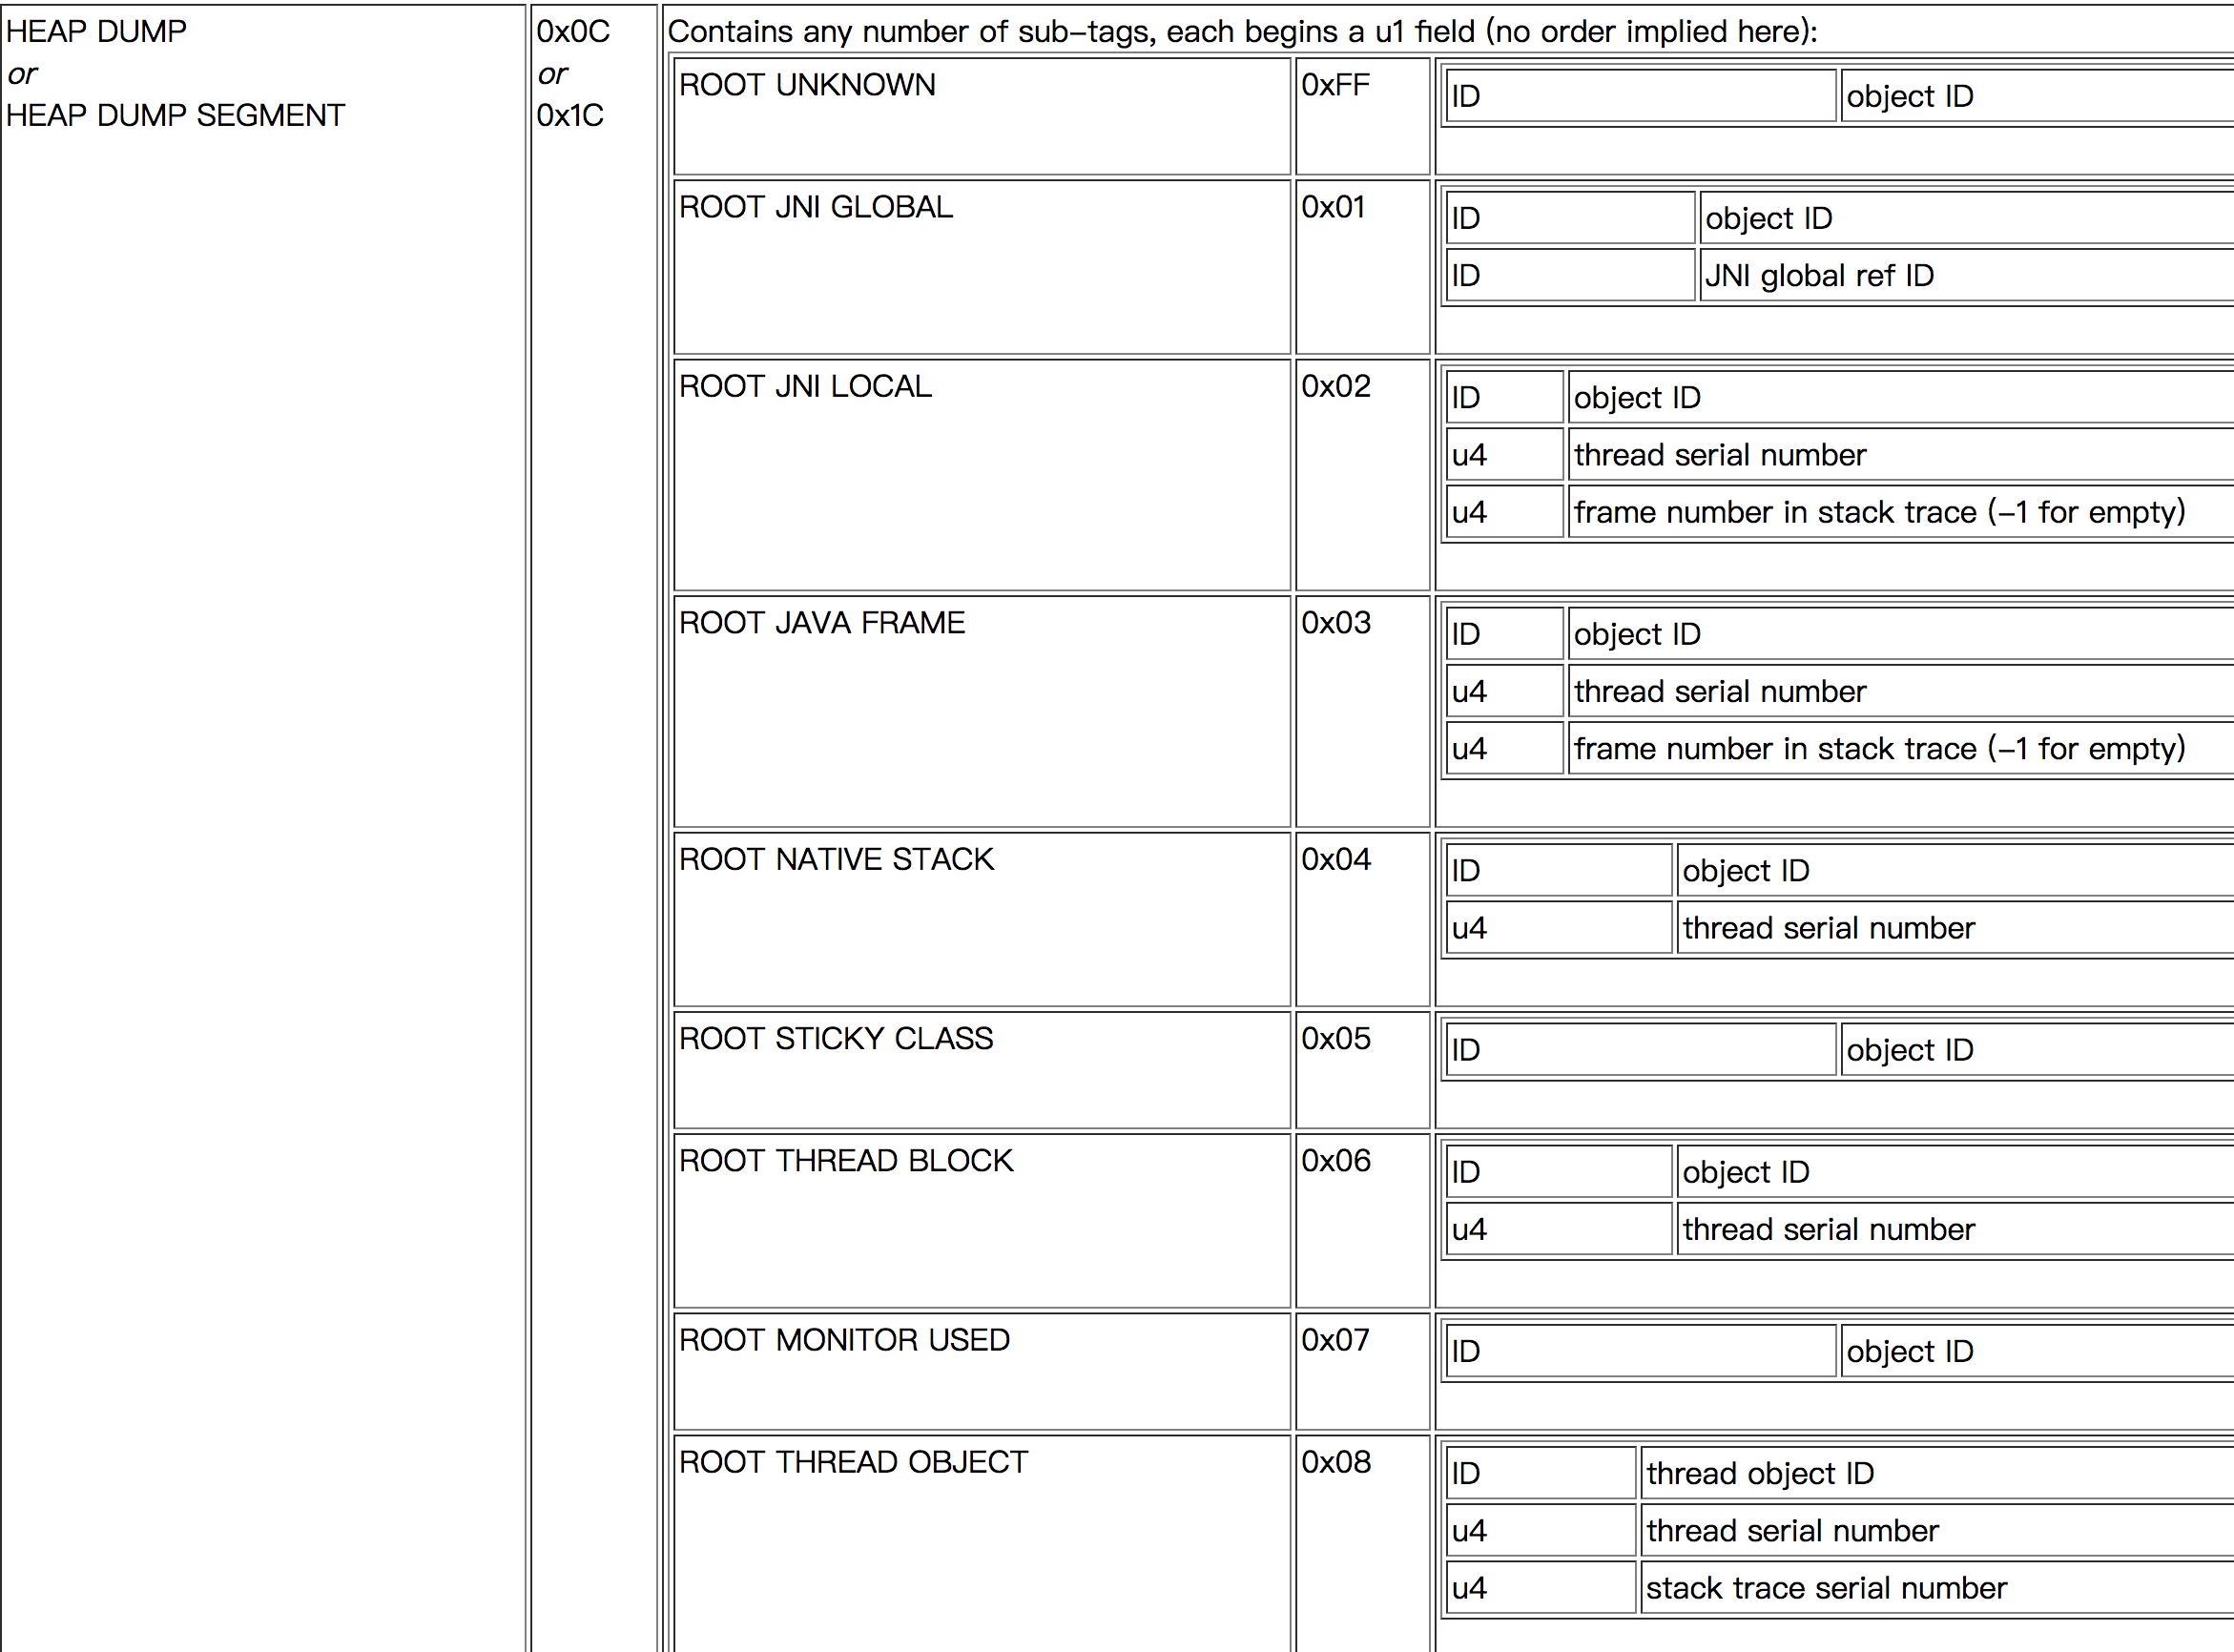
按照文档描述的格式将Hprof中的实例信息解析成对象引用关系的图结构后,套用经典的图搜索算法即可找到泄漏的Activity到GC Root的强引用链。这部分代码实现,老版的LeakCanary和Matrix都借鉴了HAHA库的逻辑。目前这个Repo已经被标记为DEPRECATED,最新版的LeakCanary 2自己实现了名叫Shark的heap分析库,这个库使用Kotlin实现。

Hprof文件分析

Matrix ResourceCanary将检测Activity泄漏和分析泄漏对象的信息整个过程,分成检测和分析两个阶段。前者因为检测Activity泄漏包含很多系统概念,只能在端上做,但是分析阶段是一个处理hprof文件的过程,可以拆出来。拆出来的好处是:

  • 更新分析逻辑不再需要重新发客户端版本
  • Hprof文件留在了服务端,为人工分析提供了机会
  • 如果跳过触发Dump Hprof,甚至可以把监测步骤在现网环境启用,以发现测试阶段难以触发的Activity泄漏

前面检测阶段,会生成一个压缩包,内部包含一个hrof文件和一个result.info文件,result.info内容示例如下:

1
2
3
4
5
# Resource Canary Result Infomation. THIS FILE IS IMPORTANT FOR THE ANALYZER !!
sdkVersion=28
manufacturer=Google
hprofEntry=dump_54f653434ef64d31a0296e210e192472_shrink.hprof
leakedActivityKey=MATRIX_RESCANARY_REFKEY_sample.tencent.matrix.resource.TestLeakActivity_98736b3660294fecacaa993a418563c8

hprofEntry就是创建的hprof文件名,leakedActivityKey是leak activity的信息。

hprof文件分析的代码在matrix-resouce-canary-analyzer这个module里面,入口方法是CLIMain.main(),下面来具体看下。

1
2
3
4
5
6
7
8
9
10
11
12
13
14
15
16
17
18
19
20
21
22
23
24
25
com.tencent.matrix.resource.analyzer.CLIMain

public static void main(String[] args) {
if (args.length == 0) {
printUsage(System.out);
System.exit(ERROR_NEED_ARGUMENTS);
}
try {
// 命令行参数解析
final CommandLine cmdline = new DefaultParser().parse(sOptions, args);
if (cmdline.hasOption(OPTION_HELP.mOption.getLongOpt())) {
printUsage(System.out);
System.exit(ERROR_SUCCESS);
}

parseArguments(cmdline);

// 分析hprof文件
doAnalyze();

System.exit(ERROR_SUCCESS);
} catch (MissingOptionException e) {
...
}
}

上面代码先对命令行参数进行解析,入参配置可以参考下面:

1
2
3
4
5
6
args : {
"-i", "hprof_zip_file_path",
"-o", "output_path",
"-co", "true",
"-mb", "100000"
};
  • -i:检测阶段生成的hprof压缩包文件路径,该参数必选
  • -o:分析结果输出文件路径,该参数必选
  • -co:是否将分析结果输出文件做成压缩文件,该参数可选
  • -mb:触发bitmap泄漏警告的最小尺寸,默认阈值时5000,该参数可选

这几个参数的含义可以参考CLIMain.AnalyzerOptions

参数解析完后,执行doAnalyze()进行具体分析逻辑。

1
2
3
4
5
6
7
8
9
10
11
12
13
14
15
16
17
18
19
20
21
22
23
24
25
26
27
28
29
30
31
32
33
34
35
36
37
38
39
40
41
42
43
44
45
46
47
48
49
50
51
52
53
54
55
56
57
58
59
60
61
62
63
64
65
66
67
68
69
70
71
72
com.tencent.matrix.resource.analyzer.CLIMain

private static void doAnalyze() throws IOException {
// 解析检测阶段生成的result.info文件,并将信息保存到resultInfoMap
ZipFile zf = null;
BufferedReader br = null;
File tempHprofFile = null;
try {
zf = new ZipFile(mInputFile);
final ZipEntry canaryResultInfoEntry = new ZipEntry("result.info");
final Map<String, String> resultInfoMap = new HashMap<>();
br = new BufferedReader(new InputStreamReader(zf.getInputStream(canaryResultInfoEntry)));
String confLine = null;
while ((confLine = br.readLine()) != null) {
if (confLine.startsWith("#")) {
// Skip comment.
continue;
}
final String[] kvPair = confLine.split("\\s*=\\s*");
if (kvPair.length != 2) {
// Skip bad config line.
continue;
}
final String key = kvPair[0].trim();
final String value = kvPair[1].trim();
resultInfoMap.put(key, value);
}

// 从result.info中解析出sdkVersion、manufacturer、hprofEntry、leakedActivityKey
final String sdkVersionStr = resultInfoMap.get("sdkVersion");
if (sdkVersionStr == null) {
throw new IllegalStateException("sdkVersion is absent in result.info.");
}
final int sdkVersion = Integer.parseInt(sdkVersionStr);

final String manufacturer = resultInfoMap.get("manufacturer");
if (manufacturer == null) {
throw new IllegalStateException("manufacturer is absent in result.info.");
}

final String hprofEntryName = resultInfoMap.get("hprofEntry");
if (hprofEntryName == null) {
throw new IllegalStateException("hprofEntry is absent in result.info.");
}
final ZipEntry hprofEntry = new ZipEntry(hprofEntryName);

final String leakedActivityKey = resultInfoMap.get("leakedActivityKey");
if (leakedActivityKey == null) {
throw new IllegalStateException("leakedActivityKey is absent in result.info.");
}

// 将hprof信息复制到临时文件中
// We would extract hprof entry into a temporary file.
tempHprofFile = new File(new File("").getAbsoluteFile(), "temp_" + System.currentTimeMillis() + ".hprof");
StreamUtil.extractZipEntry(zf, hprofEntry, tempHprofFile);

// 解析extra.info
// Parse extra info if exists.
...

// 执行分析逻辑
// Then do analyzing works and output into directory or zip according to the option. Besides,
// store extra info into the result json by the way.
analyzeAndStoreResult(tempHprofFile, sdkVersion, manufacturer, leakedActivityKey, extraInfo);
} finally {
if (tempHprofFile != null) {
tempHprofFile.delete();
}
StreamUtil.closeQuietly(br);
StreamUtil.closeQuietly(zf);
}
}

上面代码主要是解析检测阶段生成的result.info文件的数据,后续通过analyzeAndStoreResult()进行分析。

1
2
3
4
5
6
7
8
9
10
11
12
13
14
15
16
17
18
19
20
21
22
23
24
25
26
27
28
29
30
31
32
33
34
35
36
37
38
39
40
41
42
43
44
45
46
47
48
49
50
51
52
53
54
55
56
57
58
59
60
61
62
63
64
65
66
67
68
69
70
71
72
73
74
75
76
77
78
79
80
81
82
83
84
85
com.tencent.matrix.resource.analyzer.CLIMain

private static void analyzeAndStoreResult(File hprofFile, int sdkVersion, String manufacturer, String leakedActivityKey, JSONObject extraInfo) throws IOException {

//使用HAHA库解析Hprof
final HeapSnapshot heapSnapshot = new HeapSnapshot(hprofFile);
final ExcludedRefs excludedRefs = AndroidExcludedRefs.createAppDefaults(sdkVersion, manufacturer).build();

// 执行获取最短强引用链逻辑
final ActivityLeakResult activityLeakResult
= new ActivityLeakAnalyzer(leakedActivityKey, excludedRefs).analyze(heapSnapshot);

// SDK小于26,分析冗余Bitmap
DuplicatedBitmapResult duplicatedBmpResult = DuplicatedBitmapResult.noDuplicatedBitmap(0);
if (sdkVersion < 26) {
final ExcludedBmps excludedBmps = AndroidExcludedBmpRefs.createDefaults().build();
duplicatedBmpResult = new DuplicatedBitmapAnalyzer(mMinBmpLeakSize, excludedBmps).analyze(heapSnapshot);
} else {
System.err.println("\n ! SDK version of target device is larger or equal to 26, "
+ "which is not supported by DuplicatedBitmapAnalyzer.");
}
final String resultJsonName = "result.json";
final String bufferContentsRootDirName = "buffer_contents";
final String extralInfoKey = "extraInfo";

// 将解析结果转换成zip压缩包格式
if (mCompressOutput) {
ZipOutputStream zos = null;
try {
zos = new ZipOutputStream(new BufferedOutputStream(new FileOutputStream(mOutputFile)));
final ZipEntry analyzeResultEntry = new ZipEntry(resultJsonName);
zos.putNextEntry(analyzeResultEntry);
try {
final PrintWriter pw = new PrintWriter(zos);
final JSONObject resultJson = new JSONObject();
final JSONObject activityLeakResultJson = new JSONObject();
activityLeakResult.encodeToJSON(activityLeakResultJson);
final JSONObject duplicatedBmpResultJson = new JSONObject();
duplicatedBmpResult.encodeToJSON(duplicatedBmpResultJson);

resultJson.put("activityLeakResult", activityLeakResultJson)
.put("duplicatedBitmapResult", duplicatedBmpResultJson);

if (extraInfo != null && extraInfo.length() > 0) {
resultJson.put(extralInfoKey, extraInfo);
}

pw.println(resultJson.toString());
pw.flush();
} finally {
try {
zos.closeEntry();
} catch (Throwable ignored) {
// Ignored.
}
}

// Store bitmap buffer.
final List<DuplicatedBitmapEntry> duplicatedBmpEntries = duplicatedBmpResult.getDuplicatedBitmapEntries();
final int duplicatedBmpEntryCount = duplicatedBmpEntries.size();
for (int i = 0; i < duplicatedBmpEntryCount; ++i) {
final DuplicatedBitmapEntry entry = duplicatedBmpEntries.get(i);
final BufferedImage img = BitmapDecoder.getBitmap(
new HprofBitmapProvider(entry.getBuffer(), entry.getWidth(), entry.getHeight()));
// Since bmp format is not compatible with alpha channel, we export buffer as png instead.
final String pngName = bufferContentsRootDirName + "/" + entry.getBufferHash() + ".png";
try {
zos.putNextEntry(new ZipEntry(pngName));
ImageIO.write(img, "png", zos);
zos.flush();
} finally {
try {
zos.closeEntry();
} catch (Throwable ignored) {
// Ignored.
}
}
}
} finally {
StreamUtil.closeQuietly(zos);
}
} else {
...
}
}

上面先在HeapSnapshot(File hprofFile)内部使用HAHA库解析Hprof文件,再通过ActivityLeakAnalyzer().analyze()分析泄漏Activity的最短强引用链。

分析结果中,ActivityLeakResultreferenceChain内容如下:

1
2
3
4
5
6
7
8
9
* GC ROOT android.os.HandlerThread contextClassLoader
* references dalvik.system.PathClassLoader runtimeInternalObjects
* references array java.lang.Object[] [412]
* references static sample.tencent.matrix.resource.TestLeakActivity testLeaks
* references java.util.HashSet map
* references java.util.HashMap table
* references array java.util.HashMap$Node[] [0]
* references java.util.HashMap$Node key
* leaks sample.tencent.matrix.resource.TestLeakActivity instance

最后一行显示sample.tencent.matrix.resource.TestLeakActivity发生泄漏,从下到上是TestLeakActivity到GCRoots的强引用链。从第四行可以看到静态变量testLeaks,这个检测结果和前面讲到静态变量testLeaks持有TestLeakActivity导致其无法释放的结论是一致的。

Hprof文件格式说明

在介绍haha库如何解析Hprof之前,先简单介绍下Hprof文件的结构。

Hprof文件主要由一系列的record组成,每一个record的内容结构如下:
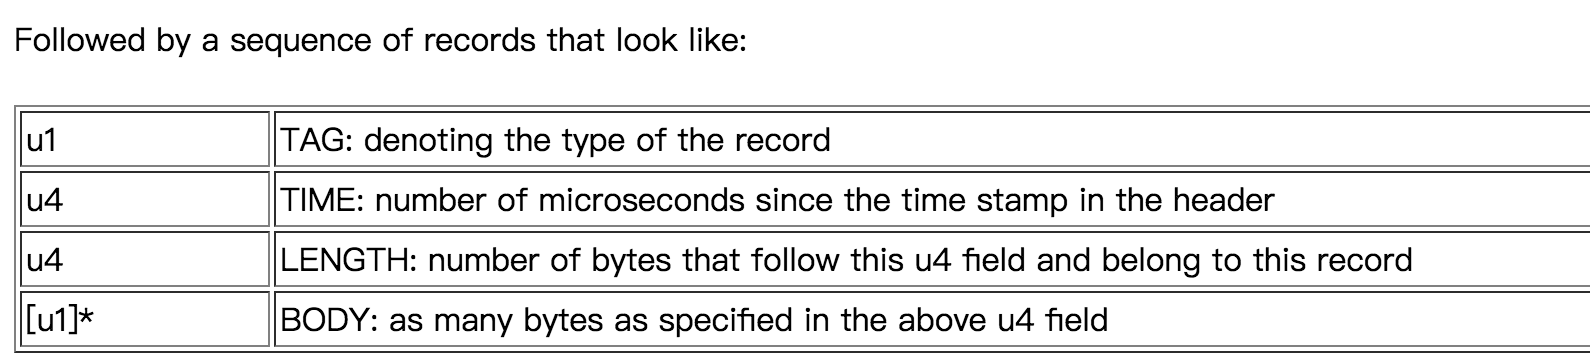
每一个record包含四部分内容:

  • TAG:该record内容的类型,比如string数据是0x01,LOAD ClASS是0x02,栈帧Stack Frame是0x04
  • TIME:时间戳,作用不大,占4个字节,代码中也忽略不用
  • LENGTH:表示body的长度
  • BODY:实体内容

其中u1、u2、u4、u8代表几个byte,比如u4就代表占用4个字节。

每一种record类型都对应着一个tag,目前支持的tag部分内容如下,具体参考HPROF Agent Binary Dump Format这一节:

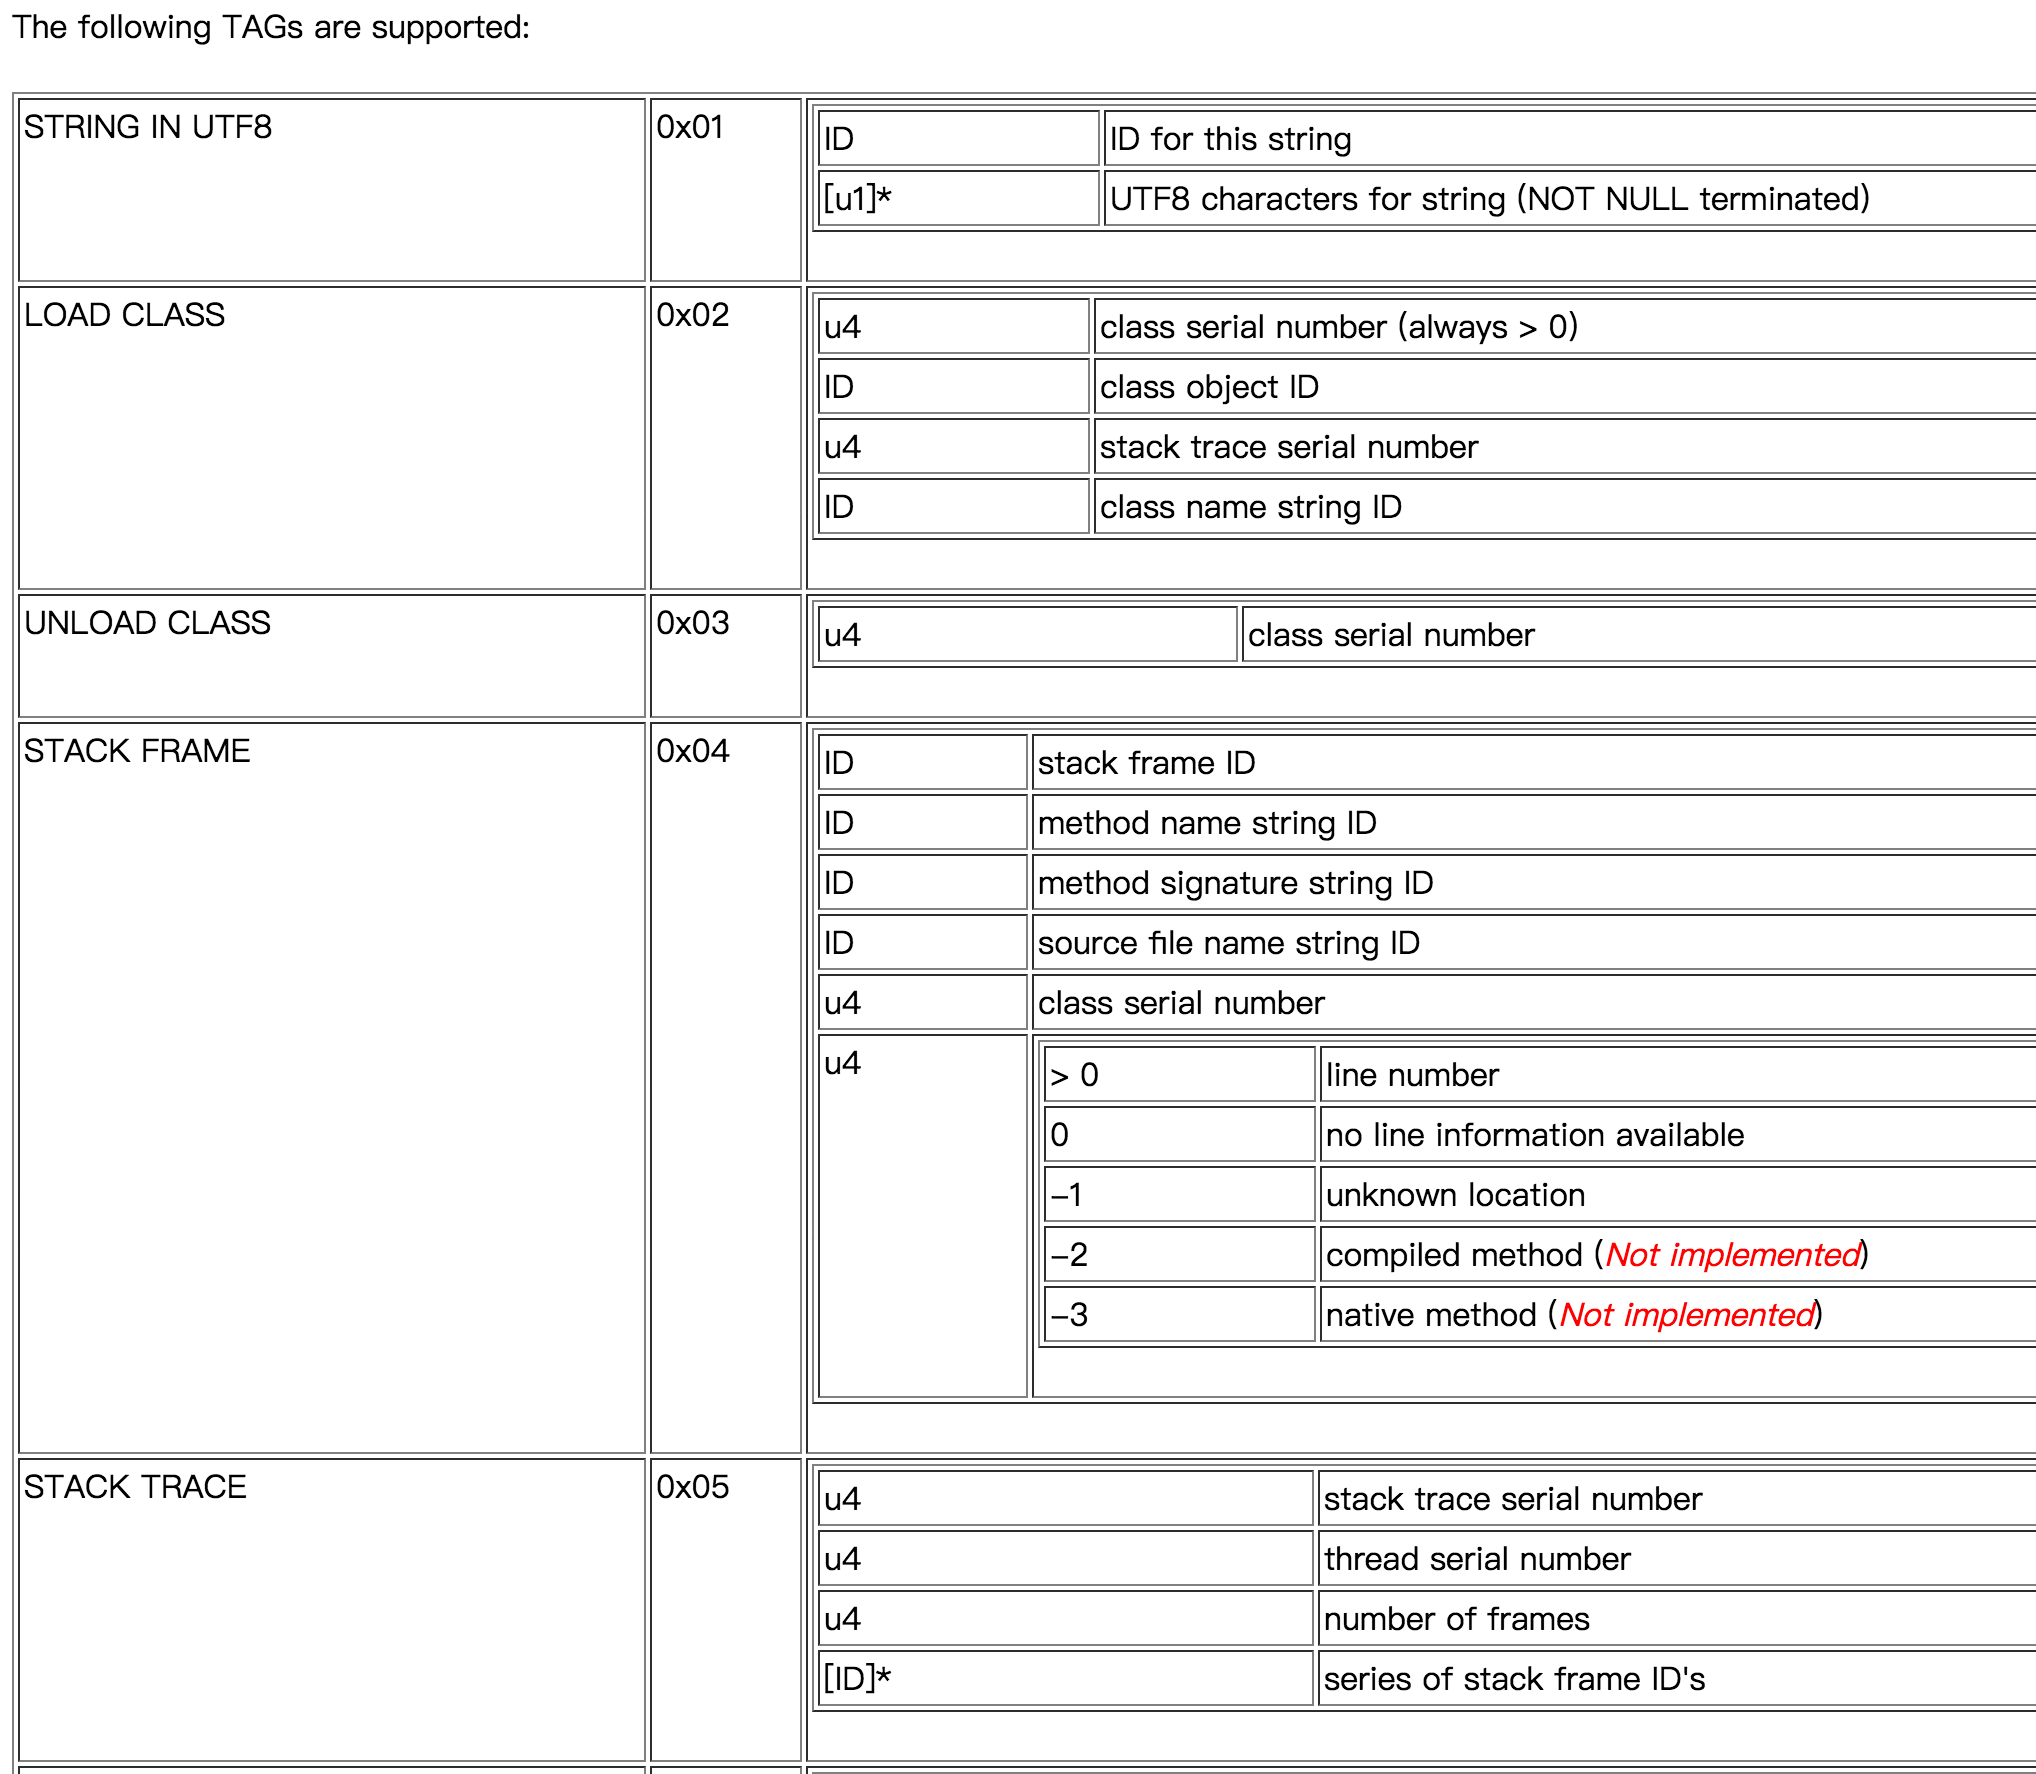
比如string数据是0x01,LOAD ClASS是0x02,stack frame是0x04,stack trace是0x05等等。

HAHA库解析Hprof

先看下HAHA库的解析逻辑:

1
2
3
4
5
6
7
8
9
10
11
12
13
14
15
16
17
18
19
20
21
22
com.tencent.matrix.resource.analyzer.model.HeapSnapshot

public class HeapSnapshot {

private final File mHprofFile;
private final Snapshot mSnapshot;

public HeapSnapshot(File hprofFile) throws IOException {
mHprofFile = checkNotNull(hprofFile, "hprofFile");
//解析出SnapShot
mSnapshot = initSnapshot(hprofFile);
}

private static Snapshot initSnapshot(File hprofFile) throws IOException {
final HprofBuffer buffer = new MemoryMappedFileBuffer(hprofFile);
final HprofParser parser = new HprofParser(buffer);
//实际解析逻辑
final Snapshot result = parser.parse();
AnalyzeUtil.deduplicateGcRoots(result);
return result;
}
}

上面代码重点在HprofParser.parse(),当前Matrix版本使用haha-2.0.3版本:

1
2
3
4
5
6
7
8
9
10
11
12
13
14
15
16
17
18
19
20
21
22
23
24
25
26
27
28
29
30
31
32
33
34
35
36
37
38
39
40
41
42
43
44
45
46
47
48
49
50
51
52
53
54
55
56
57
58
59
60
61
62
63
64
65
66
67
68
69
com.squareup.haha.perflib.HprofParser

public final Snapshot parse() {
Snapshot snapshot = new Snapshot(mInput);
mSnapshot = snapshot;

try {
try {
readNullTerminatedString(); // Version, ignored for now.

mIdSize = mInput.readInt(); //解析ID长度,默认u4
mSnapshot.setIdSize(mIdSize);

mInput.readLong(); // Timestamp, ignored for now.

while (mInput.hasRemaining()) {
int tag = readUnsignedByte(); //解析TAG
mInput.readInt(); // Ignored: timestamp,忽略时间戳
long length = readUnsignedInt(); //解析LENGTH

//根据tag及length,解析body
switch (tag) {
case STRING_IN_UTF8: // tag为0x01
// String length is limited by Int.MAX_VALUE anyway.
loadString((int) length - mIdSize);
break;

case LOAD_CLASS: // tag为0x02
loadClass();
break;

case STACK_FRAME: // tag为0x04
loadStackFrame();
break;

case STACK_TRACE: // tag为0x06
loadStackTrace();
break;

case HEAP_DUMP: // tag为0x0C
loadHeapDump(length);
mSnapshot.setToDefaultHeap();
break;

case HEAP_DUMP_SEGMENT: // tag为0x1C
loadHeapDump(length);
mSnapshot.setToDefaultHeap();
break;

default:
skipFully(length); // 跳过当前record
}

}
} catch (EOFException eof) {
// this is fine
}
mSnapshot.resolveClasses();
mSnapshot.resolveReferences();
// TODO: enable this after the dominators computation is also optimized.
// mSnapshot.computeRetainedSizes();
} catch (Exception e) {
e.printStackTrace();
}

mClassNames.clear();
mStrings.clear();
return snapshot;
}

上面parse()中的while循环,开始都会先读取TAG、TIME、LENGTH这三个部分的内容,然后再根据tag和length解析body,即对应类型的值:

1
2
3
int tag = readUnsignedByte();
mInput.readInt(); // Ignored: timestamp
long length = readUnsignedInt();

拿stack frame举例:

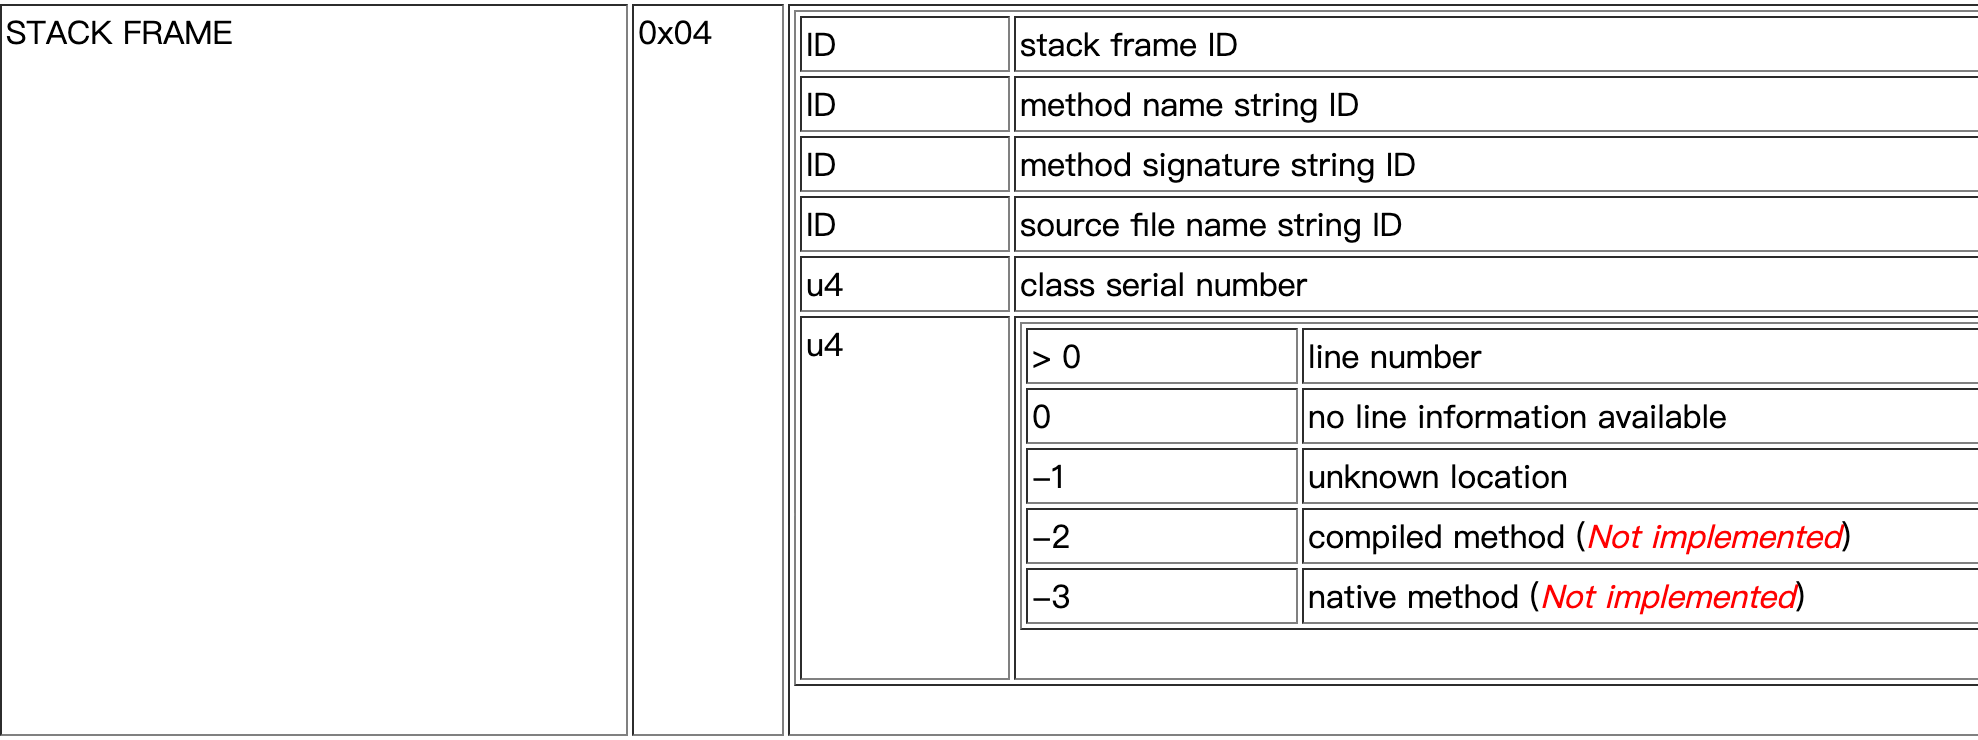
栈帧中包含方法名、签名、源文件名、类序列号、行号等信息。

通过下面代码可以看到如何获取body中的信息:

1
2
3
4
5
6
7
8
9
10
11
12
13
14
15
com.squareup.haha.perflib.HprofParser

private void loadStackFrame() throws IOException {
long id = readId(); //stack frame ID
String methodName = mStrings.get(readId()); //根据方法名id到strings中获取方法名字符串
String methodSignature = mStrings.get(readId()); //method signature,和获取方法名逻辑一样
String sourceFile = mStrings.get(readId()); // source file name
int serial = mInput.readInt(); // class serial number
int lineNumber = mInput.readInt(); // line number

StackFrame frame = new StackFrame(id, methodName, methodSignature,
sourceFile, serial, lineNumber);

mSnapshot.addStackFrame(frame);
}

上面每一行的内容和文档中对STACK FRAME的格式描述严格一致。所以,为什么说HAHA库是把Hprof这种文档描述结构转义成了引用关系结构,也是这个原因。

如何检测重复Bitmap对象

这部分内容,实现思路wiki中的描述如下:原理简单粗暴——把所有未被回收的Bitmap的数据buffer取出来,然后先对比所有长度为1的buffer,找出相同的,记录所属的Bitmap对象;再对比所有长度为2的、长度为3的buffer……直到把所有buffer都比对完,这样就记录下了所有冗余的Bitmap对象了,接着再套用LeakCanary获取引用链的逻辑把这些Bitmap对象到GC Root的最短强引用链找出来即可。

参考

Matrix ResourceCanary Wiki

HPROF Agent

使用 Memory Profiler 查看 Java 堆和内存分配